Chapter 11
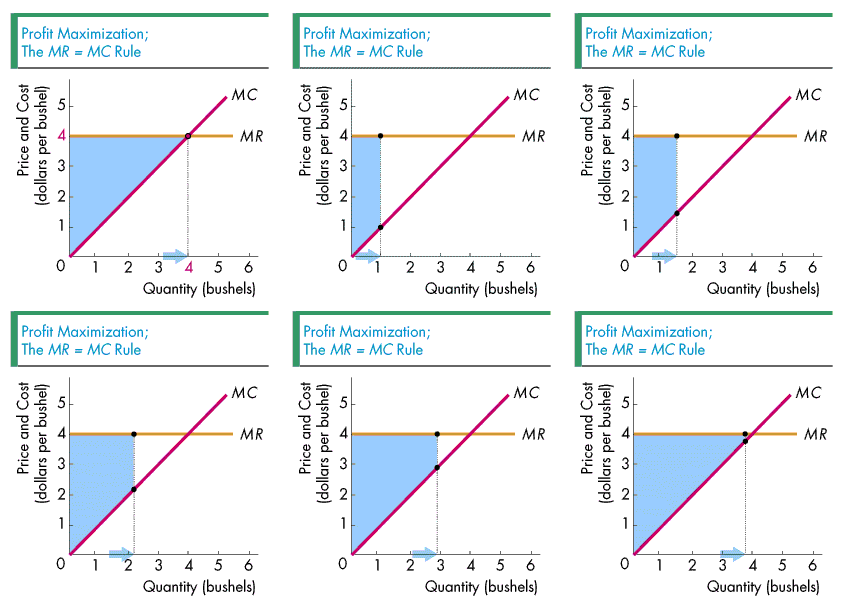
The figure shows how Jonathan's total profit - the light blue area - changes when he changes his output. (The light blue area shows the total profit for all units produced, that is, not only the profit from, say, bushel 1 and bushel 2 but also the profit from fractional bushels, such as bushel 2/3 and bushel 1 3/4.) The figure makes clear that Jonathan's total profit - the blue area - is largest when Jonathan produces 4 bushels of wheat, precisely the level of output for which the marginal revenue, MR, equals the marginal cost, MC.
In other words, we have just seen that Jonathan maximizes his total profit by producing where MR = MC, which is precisely the same result established on page 238 in the textbook. In fact, keep the "MR = MC rule" firmly in mind because it is going to recur in the next two chapters and be just as significant there as it is here!

The MR = MC rule, as well as the diagram showing how much a perfectly competitive firm produces are both extremely important. It is a fair statement to rank them along side use of the supply and demand model as among the most important topics in the class. They recur throughout the chapter (and the class) and they help us make sense of events we see in the real world. Hence you definitely want to be sure that you thoroughly understand the rule, (including the meanings of marginal revenue and marginal cost) as well as the diagrams. Fortunately, the Study Guide has lots of questions and added help so that that practice and refine your grasp of these crucial subjects. In the Study Guide, check out True or False questions 8 to 10; Multiple Choice questions 5, and 6; and Short Answer question 5, 6, and 8. You should not miss True/False/Uncertain question 2, Mutliple Choice question 21, and Problem 3. Be sure not to miss any of these questions.
Would you like to study another chapter.