Chapter 15
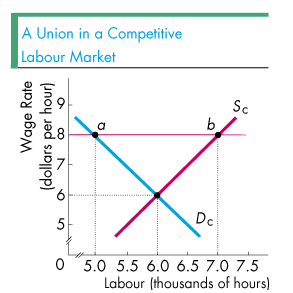
The effect of unions in a competitive labour market is analyzed using the supply and demand model that we have developed in earlier chapters, particularly Chapters 4 and 7. The material on pages 4 to 10 of Chapter 15 of the textbook explains the basic problem a union faces. In addition, the figure on this page can illustrate a union's basic problem. In the figure, the labour demand curve is Dc and the labour supply curve is Sc so that, before the union is established, the equilibrium wage rate is $6 per hour and equilibrium employment is 6,000 hours of labour per day.
After its formation, the union wants to increase the wage paid its members and expand job opportunities. How can the union accomplish these goals? At first glance it might appear that the union should negotiate a higher wage rate, say, $8 per hour. But, if boosting the wage rate is all that the union accomplishes, firms respond by decreasing the quantity of labour they employ. As point a in the figure shows, at a wage rate of $8 per hour firms hire 5,000 hours of labour. Sure, at the wage rate of $8, workers are willing to supply 7,000 hours of employment (point b in the figure), but firms are hiring only 5,000 hours. Hence the higher wage rate has created lower employment, from 6,000 hours to 5,000, for the union members. Creating unemployment among its members is hardly the outcome the union wants!
So, what can unions do to avoid this unpleasant outcome? Click on the figure below to see half the answer.